-
About
- About Listly
- Community & Support
- Howto
- Chrome Extension
- Bookmarklet
- WordPress Plugin
- Listly Premium
- Privacy
- Terms
- DMCA Copyright
- © 2010-2025 Boomy Labs

 Carl V Lewis
Listly by Carl V Lewis
A bootcamp in data, code & algorithms for investigative & creative work | @columbiajourn | Apply by 2/15/2016 | jrncompuation@columbia.edu
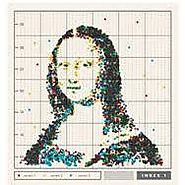
Tweets about Cool stuff related to #DataViz #PixelArt #AI #MachineLearning & #DataScience
The ultimate-most-supreme source of articles on data visualisation and technical information design. Source suggestions are welcome.

Assistant Director, Tow Center for Digital Journalism @ Columbia J School. Digital security, data journalism, information visualization. http://t.co/oaRiOidMWH

news apps developer @wsjgraphics, previously @nytimes & @uncmjschool
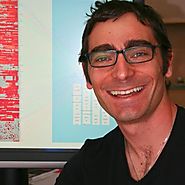
Assistant Professor at NYU. Father of 3. I study, teach, and write about data visualization.
Statistician,visualizer,artist. Professor PoliSci, Statistics,CompSci Yale+Princeton 33 years. Founded Graphics Press, Hogpen Hill Tree Farms, ET Modern Gallery
Crowdmap is a simple map-making tool, built on an open API, that allows you and the world to collaboratively map your world.

Newsroom developer and datajournalist working for Bergens Tidende, bt.no. Map geek.
multimedia journalist & @AJC producer constantly in pursuit of ways to enhance news & interactive storytelling. Share something cool with me!

New Orleans' first independent, nonprofit news site. We provide the information and analysis necessary to advocate for more accountable and just governance.

We enable enterprises to #unlockdatavalue by sharing engaging analytics with their entire network, providing #analyticsatscale.
Professor Global Health, Karolinska Institutet.
Edutainer & co-founder of Gapminder Foundation

Founder of @DataHero. Employee #1 at @AsterData. Empowering people to get answers from the data that matters to them.
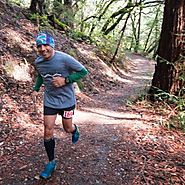
CTO @menlosecurity Love startups, ultra running, cooking & story-telling, not always in that order. Advisor @NetSkope @PreemptSecurity
Visiting professional @TCUjournalism & editor @TheLensNOLA. Older than I look. Was at @Poynter. Wish I rode my motorcycle more. myers.news@gmail (504) 298-9750

Data visualization as design, science, art, journalism. Co-leader of Google's Big Picture visualization research group.

Information designer. Author of the Feltron Annual Reports. Facebook timeline designer. Co-creator of Reporter and Daytum apps.

Data, Products, Startups. Co-Founder, Repable. Board member, advisor & mentor to others.

http://t.co/kwtDyFn6dC covers current challenges, interviews with leading actors and book reviews related to data mining, analytics and data science.

I'm the Director of Technology for New Digital Products at the New York Times.

Statistician, with a specialty in visualization and a background in eating and beer. FlowingData.
