-
About
- About Listly
- Community & Support
- Howto
- Chrome Extension
- Bookmarklet
- WordPress Plugin
- Listly Premium
- Privacy
- Terms
- DMCA Copyright
- © 2010-2025 Boomy Labs

 Carl V Lewis
Listly by Carl V Lewis
Front-end tools, JavaScript libraries and more to help you visualize your data.
Want to make a visual timeline, but don't have the time to draw one manually? Or maybe you have some documents, but you're not sure if the events they depict form a compelling timeline?
Web Application for building Infographics and Visual Content
Venngage is an easy to use Infographics Tool and helps you make beautiful Infographic Designs & Themes for free!

Datawrapper is an open source tool helping everyone to create simple, correct and embeddable charts in minutes.

Basic tutorial on Raw, an online app for designers and vis geeks, aiming at providing a missing link between spreadsheet applications (e.g. Microsoft Excel, Apple Numbers, OpenRefine) and vector graphics editors (e.g. Adobe Illustrator, Inkscape, ...). Try the application here: raw.densitydesign.org
See examples of live web charts made with the ZingChart JavaScript charting library.
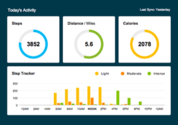
ZingChart is a JavaScript charting library designed to quickly render fast, beautiful charts with big data sets. Start building JavaScript charts today.

Detective.io makes it easy to explore networks. Because it structures your research, you can analyze connections in your collected data in seconds.
Beautifully crafted timelines that are easy, and intuitive to use.
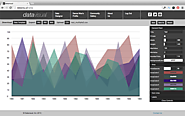
Our mission is to make data visual for everyone. Using our simple user interface we empower individuals and organizations to easily create and share beautiful visualizations.
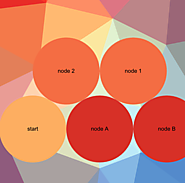
Create ubique network and tree diagrams using WYSIWYG nested structures built on top of Google Sheets.

"good-looking charts shouldn't be difficult" -- A gorgeous JS library of basic chart types with easy customization options.
Open source D3.js-based charting and visualization library for data exploration and data analysis

Dragula provides the easiest possible API to make cross-browser (IE7 included!) drag-and-drop a breeze in your applications.
