Catherine Pham
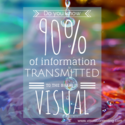
90% of information transmitted to the brain is visual, and visuals are processed 60,000X faster in the brain than text. (Sources: 3M Corporation and Zabisco)
40% of people will respond better to visual information than plain text. (Source: Zabisco)
Visual content drives engagement. In fact, just one month after the introduction of Facebook timeline for brands, visual content — photos and videos — saw a 65% increase in engagement. (Source: Simply Measured)
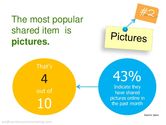
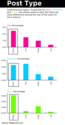
On Facebook, photos perform best for likes, comments, and shares as compared to text, video, and links. (Source: Dan Zarrella)
85% of the US internet audience watches videos online. The 25-34 age group watches the most online videos, and adult males spend 40% more time watching videos on the internet than females. (Sources:comScore and Nielsen)
Over 72 hours of videos are uploaded each minute on YouTube.com. (Source: YouTube)
25 million smartphone users stream 4 hours of mobile video per month. 75% of smartphone users watch videos on their phones, 26% of whom use video at least once a day. (Sources: Ooyala and Ipsos)
Mobile video subscription is expected to hit $16 billion in revenue by 2014, with over 500 million subscribers. (Source: Ooyala)
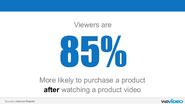
Viewers are 85% more likely to purchase a product after watching a product video. (Source: Internet Retailer)
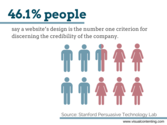
46.1% of people say a website’s design is the number one criterion for discerning the credibility of the company. (Source: Stanford Persuasive Technology Lab)

Covering all things business, start-up and marketing.