 Ivan Landuyt
As part of the regional knowledge center, data- and indicator sets for the region will be collected, analyzed and presented. Analysts should be provided with flexible tools for analysis and research, the public should be exposed to interactive data presentations. The list presents candidate applications to do the job.
Data visualization software from Datawatch. Datawatch provides visual data discovery software that optimizes any data - regardless of its variety, volume, or velocity - delivering next generation analytics to reveal valuable insights for improving business.
In a recent global BI survey, 100% of Yellowfin customers surveyed said they would recommend Yellowfin to their peers and colleagues. We work hard to make sure our customers are happy.
Birst is a serious business intelligence platform born in the Cloud-and it can help you solve real business problems by bringing all of your data together.
Create and share visual ideas online.
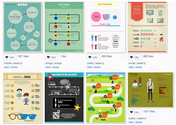
Piktochart helps you to create infographics, share and get results in 3 easy steps No design experience required.
Tableau can help anyone see and understand their data. Connect to almost any database, drag and drop to create visualizations, and share with a click.
The QlikView Business Discovery platform delivers true self-service business intelligence that empowers business users and drives innovative decision making
Cambridge Advanced Modeller is a software tool for modelling and analysing the dependencies and flows in complex systems - such as products, processes and organisations. It provides a diagrammer, a simulation tool, and a DSM tool.
StatPlanet (aka StatPlanet Map Maker) is free software for creating interactive maps. Create interactive world maps, USA maps, or custom-designed maps.
An online visualization program, run on Java, causing problems with Chrome being a 32-bits browser. Very nice and straightforward. Create and share directly.
Formats:
- word tree, word cloud, phrase net
- bar chart, bubble chart, block histogram, view in context
- pie chart, heat map, tree map, scatter plot
Software for qualitative data analysis in every setting - from market research to content analysis and evaluation. QSR International's products: XSight and NVivo are designed to help researchers and other people analyzing audio, video, photos, Word documents and PDF documents to compile, compare and make sense of their information quickly and easily.
Learn about how the world's most widely used business intelligence suite leverages open source for the best and most cost-effective reporting, dashboards and analytics available.
Now integrated with tibbr.
Build custom branded reports, presentations, and charts with our platform for automating beautiful design.
Datameer is a Big Data Analytics solution for Hadoop that empowers business users to directly integrate, analyze, and visualize any data.
Sprites is a free tool for creating beautiful animated infographics for the Web.
Analytics8 is a data and analytics consulting firm that speciailizes in data strategy and business intelligence implementations. We help organizations make smart, data-driven decisions by translating their data into meaningful and actionable information.

Senior consultant in knowledge management, strategic management, e-learning, project management and training.