 Ivan Landuyt
A collection of references to how-to resources and nice examples of data representation by means of Tableau Public, a data representation tool.
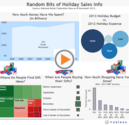
A viz in progress, I think. I wanted to play around a bit and since we just went through one of the biggest shopping weekends of the season, I thought it would be fun to have random bits of holiday...
This is the fourth post in a series of guest blog entries by Tableau Public authors for Design Month. Anya A'Hearn is an Iron Viz champion and a business intelligence consultant with her company Datablick.
I consider presentation and storytelling the next step in visualization, after most of the focus has been on exploration and analysis so far. An upcoming version of Tableau will include a feature called Story Points, which supports presentation directly in the visualization tool.
A set of video's on how to use Tableau.
Video's on the working with Tableau Public 8.
Tableau has been developed and designed with the end user in mind. In other words you don't have to be an IT specialist to work with data. Like most software, Tableau Public can be of most benefit once you've grasped the core principles.
The whole purpose of Tableau Public is to share data in an interactive way with other people on the web. Whether you're the original author of a visualization, or a reader who has discovered something amazing, we've tried to make it as easy as possible for you to spread the good word.
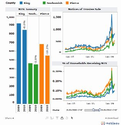
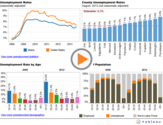
This German broadcaster analyses the labor market in the Bavarian region, south east of Germany. Switch between tabs to get a better understanding of the unemployment figures over time and by area and use icons on the bottom to see data at districts level.
Penny Henry of Maine.gov shows the main demographic and economic indicators for the state of Maine. An example of a regional data set made accessible.

Senior consultant in knowledge management, strategic management, e-learning, project management and training.