-
About
- About Listly
- Community & Support
- Howto
- Chrome Extension
- Bookmarklet
- WordPress Plugin
- Listly Premium
- Privacy
- Terms
- DMCA Copyright
- © 2010-2025 Boomy Labs
 Mate Media
Listly by Mate Media
Here are 10 sites you can use to create infographics.
Infographics are graphics that help people understand data using charts and diagrams.
Infographics are a great way for you display data visually.
Build your infographics, then post them on your website, or submit them to the many sites that will let you show the world your infographic designs.
Source: http://matemedia.com/10-online-infographic-builder-sites

What About all the Goodies? 60% of people respond better to visual data then text. As such we have specialized in developing infographics to convey data and advertisements in a more captivating and effective way. Besides we just love creating data visualizations otherwise known as infographics!
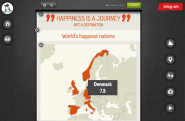
Create infographics and interactive online charts. It's free and super-easy! Follow other users and discover amazing data stories!

Piktochart is an infographic creator / maker that helps you to create the best looking infographics easily.

Like infographics and data visualization? Visual.ly is the world's largest community of infographics and data visualization. Come explore, share, and create.

Of all the job-seekers we talked to about their jobs and careers, not one said they like creating resumes. And the employers we spoke to said they get so many "me too" resumes for each open job that it is nearly impossible to select the best candidate.
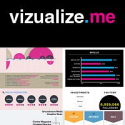
Convert your LinkedIn profile into a beautiful infographic in one click.

iCharts accelerates data storytelling with simplistic, interactive, visualization tools for big and small data providers.

Easily draw diagrams online using Creately's online diagramming tool. Diagram software packed with templates and features

Gliffy.com is a web-based diagram editor. Create and share flowcharts, network diagrams, floor plans, user interface designs and other drawings online.
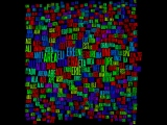
Wordle is a toy for generating "word clouds" from text that you provide. The clouds give greater prominence to words that appear more frequently in the source text. You can tweak your clouds with different fonts, layouts, and color schemes. The images you create with Wordle are yours to use however you like.
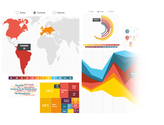
Create infographics and interactive online charts. It's free and super-easy!
Build charts online with the easy to use ChartBlock chart designer interface. Upload your data then set to work designing your chart.
