 Tina Genick
The best free and paid infographic tools to create your own.
Easily draw diagrams online using Creately’s online diagramming tool. Start drawing any diagram type now using free templates and examples
Piktochart- Make Information Beautiful. Create infographics. Engaging presentation app. Free and paid. Use of templates
Like infographics and data visualization? Visual.ly is the world's largest community of infographics and data visualization. Come explore, share, and create.
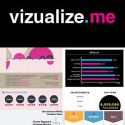
Visualize your resume in one click.
Tagxedo turns words - famous speeches, news articles, slogans and themes, even your love letters - into a visually stunning word cloud
What About all the Goodies? 60% of people respond better to visual data then text. As such we have specialized in developing infographics to convey data and advertisements in a more captivating and effective way. Besides we just love creating data visualizations otherwise known as infographics!
These guy's make infographics similar to this one as well as motion animated .gif infographics!
© 2009-2011 FluxVFX. All rights reserved.
Adobe, After Effects, are either registered trademarks or trademarks of Adobe Systems Incorporated in the United States and/or other countries.
Infogr.am is world's simplest visual storytelling app. It let's you create infographics and interactive charts in a few minutes.
Vizify TweetSheet
Create cool infographics about how, when and where you take photos on iPhone. Visualize your iPhoneography habits, learn how to make better photos and show off photo skills to your friends.
Create interactive maps using the award-winning free StatPlanet software. Explore thousands of world stats through interactive maps and data visualizations.
Online Charts Builder based on Google Charts API
The Google Public Data Explorer makes large datasets easy to explore, visualize and communicate. As the charts and maps animate over time, the changes in the world become easier to understand. You don't have to be a data expert to navigate between different views, make your own comparisons, and share your findings.
Cacoo is a user friendly online drawing tool that allows you to create a variety of diagrams such as site map, flowchart, mind map, wire frame, UML diagram and network diagram.
Blog post at Socialable : As I may have mentioned before I work closely with Sarah Arrow when it comes to blogging, she's helped me get some terrific results. She als[..]