 IoT MPLS
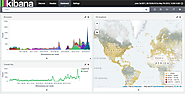
These are examples of various data visualization and analysis tools for the cloud, IoT & More
As the company behind Elasticsearch, Logstash, & Kibana, Elastic believes data should provide immediate, actionable insight. See how easy we make it.
Solr is highly reliable, scalable and fault tolerant, providing distributed indexing, replication and load-balanced querying, automated failover and recovery, centralized configuration and more. Solr powers the search and navigation features of many of the world's largest internet sites.
What Is Apache Hadoop? Getting Started Download Hadoop Who Uses Hadoop?
MongoDB (from "humongous") is an open-source document database, and the leading NoSQL database.
Know your business, grow your business. Chartio empowers the entire company to understand its data through powerful analysis and easy to create dashboards.
It's often said that data is the new world currency, and the web is the exchange bureau through which it's traded. As consumers, we're positively swimming in data; it's everywhere from labels on food packaging design to World Health Organisation reports.
R is a free software environment for statistical computing and graphics. It compiles and runs on a wide variety of UNIX platforms, Windows and MacOS. To , please choose your preferred CRAN mirror.
pandas is an open source, BSD-licensed library providing high-performance, easy-to-use data structures and data analysis tools for the Python programming language. This is a major release from 0.15.2 and includes a small number of API changes, several new features, enhancements, and performance improvements along with a large number of bug fixes.
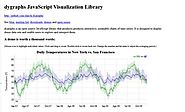
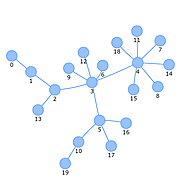
A dynamic, browser based visualization library. The library is designed to be easy to use, to handle large amounts of dynamic data, and to enable manipulation of and interaction with the data. The library consists of the components DataSet, Timeline, Network, Graph2d and Graph3d. Get it over here!
create an array with nodes var nodes = [ {id: 1, label: 'Node 1'}, {id: 2, label: 'Node 2'}, {id: 3, label: 'Node 3'}, {id: 4, label: 'Node 4'}, {id: 5, label: 'Node 5'} ]; // create an array with edges var edges = [ {from: 1, to: 2}, {from: 1, to: 3}, {from: 2, to: 4}, {from: 2, to: 5} ]; // create a network var container = document.getElementById('visualization'); var data = { nodes: nodes, edges: edges }; var network = new vis.Network(container, data, {});
Deprecated: Numeric -- Numerical Python adds a fast, compact, multidimensional array language facility to Python. (Note: superseded by NumPy) Deprecated: NumArray - http://stsdas.stsci.edu/numarray/index.html -- Numarray is a reimplementation of Numeric which adds the ability to efficiently manipulate large numeric arrays in ways similar to Matlab and IDL.
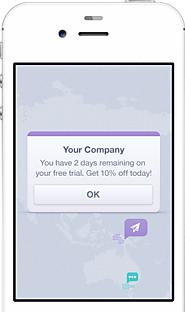
Mixpanel is the most advanced analytics platform in the world for mobile & web.
It is rightfully said that data is money in today's world. Along with the transition to an app-based world comes the exponential growth of data. However, most of the data is unstructured and hence it takes a process and method to extract useful information from the data and transform it into understandable and usable form.
The Raspberry Pi ( http://www.raspberrypi.org) is a low cost, credit-card sized computer that can be used to build amazing things. The Internet of Things (IoT) is the exploding network of objects, sensors, and "things" connected to the internet. The PiOT hands-on workshop series covers basic to advanced topics of using a Raspberry Pi to create Internet of Things applications.
Interactive charts in your browser
googleVis - Interface between R and the Google Chart Tools