
Feel free to add items and vote on your favorites:)
Integrate your email marketing campaigns and your socialmedia presence. Our infographic will help you! http://freshmail.com/blog/news-and-trends/integrate-email-campaigns-social-media-presence-infographic/
LinkedIn is a the largest professional networking site in the world. It has members in over 200 countries and is available in over 14 languages. It's growing fast, at a clip of to members per second.
The noun ‘gamification' is yet to be acknowledged as an official word in the Oxford dictionary, but it's already a trending topic among brands and marketers. PSFK's recently published Future of Gaming report supports the research which declares ‘gamification' to be simply the application of game concepts to other areas of life.
Thanks to the Internet, marketing has evolved over the years. Consumers no longer rely on billboards and TV spots - a.k.a. outbound marketing - to learn about new products, because the web has empowered them. It's given them alternative methods for finding, buying and researching brands and products.
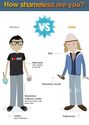
Think you're a badass? Get a custom infographic comparing your shamelessness to a friend or a character from the hit Showtime series Shameless.
In a single minute there are over 695,000 status updates on Facebook. That's just one example of the mind boggling scale of online activity. The following infographics show a bunch of other incredible things that happen in 60 seconds (via Barry Ritholtz).
You have a blog. You compose a new post. You click Publish and lean back to admire your work. Imperceptibly and all but instantaneously, your post slips into a vast and recursive network of software agents, where it is crawled, indexed, mined, scraped, republished, and propagated throughout the Web.
Despite the modern ease of digital post-production, the practice of using lens filters is very much alive. Why use Filters? Filters to your camera are what sunglasses are to your eyes. But just as sunglasses distort your vision indoors, filter can equally degrade image quality as they can improve it.
With all of the tech devices we carry around today, it's no wonder that an outlet -- or lack of one -- could make or break a business trip. Fortunatel
What's the typical Android user like? Are those who use Google's smartphone operating system and its associated gadgetry male or female? What sort of clothes do they wear? Are they married? Do they wear watches?
Beginning in 2012, Social Media Explorer will present explore - a series of one-day, intensive seminar and workshop events designed to help YOU, understand, embrace and begin deploying social media marketing in your business efforts. Sign up now! Join the list for first to know pricing and exclusive updates.
By Lauren Dugan on January 9, 2012 12:30 PM She's smart and unique, with a big mouth and lots of connections. She's Twitter, and she's one of four that this infographic from LinkingR details as being your best virtual friends out there.
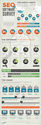
SEO Software Survey 2011 By Skyrocket SEO If you like this Infographic, you can embed it on your own website using the code below: SEO Software Survey 2011 infographic By Skyrocket SEO
Social business is a loaded term, and an increasingly popular one. Do you really know what it means? Do you know where the core value of a social business lies? The infographic below will help. 2011 was full of great commentary around how business will have to change.
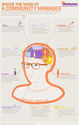
Every 4th Monday of January social media professionals gather around their warm, cozy monitors to toast Starbucks and sing viral video carols — all to celebrate Community Manager Appreciation Day. Today marks the third annual celebration of the day, started in 2010 by Jeremiah Owyang.
The community manager is the most popular role among social media teams (according to Altimeter). It has emerged as the main public face of the social media efforts for most companies. Some companies choose to use junior level employees to manage their online communities, while others commit large teams with hierarchies to the task.
In honor of Community Manager Appreciation Day we've prepped this infographic taking you inside the mind of today's community manager.
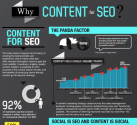
Posted by Irina on January 31, 2012 | 8 Comments " When you think of SEO, do you think of content marketing? You should. Discover why the information you put on your website, your content, matters and how it can impact your search engine ranking.
If you asked me about the key figures of 2011, Justin Bieber and Charlie Sheen would be the last names to come out of my mouth. And yet, according to the 75% of us who use social media, these two are this year's most important figures.
Ever wonder the secret to your favorite viral videos? Check out the magic of Internet memes in this handy infographic.
9th February 2012 by Martin Bryant Ben Lang of Wibiya and Sivan Cohen of Conduit have come up with this graphic that neatly sums up the readerships of some of the world's most popular tech blogs. We think they've pretty much nailed most of these, although Pando Daily's ‘Techie tree huggers' raised an eyebrow.
It is said that 50% (or more) of marriages end in divorce: a statistic scary enough to make many think hard before proposing or walking down the isle.
If you're new here, you may want to subscribe to my RSS feed. Thanks for visiting! Provided by: http://www.phoenix-training.co.uk/
Every now and then an infographic comes along that isn't just informative, but it gets you to think beyond what you know or think you know. This is one such infographic...it opens the mind's door to explore possibilities in how a social network can change the world.


![Integrate your email campaigns and your social media presence [infographic]](http://media.list.ly/production/2271/1058610/item1058610_185px.jpeg?ver=9095150607)
![What is LinkedIn? [infographic]](http://media.list.ly/production/2271/12174/item12174_185px.jpeg?ver=4867792554)
![How Is Gamification Influencing Mainstream Corporate Culture? [Infographic] @PSFK](http://media.list.ly/production/2271/12186/item12186_185px.jpeg?ver=2551555284)
![Inbound Marketing vs. Outbound Marketing [INFOGRAPHIC]](http://media.list.ly/production/2271/12113/item12113_185px.png?ver=8770626649)


![Typical Android User is Anything But Typical [INFOGRAPHIC]](http://media.list.ly/production/2271/12184/item12184_185px.jpeg?ver=2836255143)
![Social Business DNA [Infographic] | Social Media Explorer](http://media.list.ly/production/2271/12189/item12189_185px.png?ver=2533495748)
![Meet Your Virtual Friends: Google, LinkedIn, Twitter And Facebook [INFOGRAPHIC] - AllTwitter](http://media.list.ly/production/2271/12408/item12408_185px.jpeg?ver=4078008416)

![The 2012 Community Manager Report [INFOGRAPHIC]](http://media.list.ly/production/2271/13106/item13106_185px.png?ver=0364728127)

![Going Viral Visualized [INFOGRAPHIC]](http://media.list.ly/production/2271/14474/item14474_185px.jpeg?ver=8703717554)


![How Personality Impacts Job Satisfaction [Infographic] | Riding the Waves of Personal Development](http://media.list.ly/production/2271/14702/item14702_185px.jpeg?ver=1189663808)