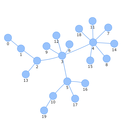
create an array with nodes var nodes = [ {id: 1, label: 'Node 1'}, {id: 2, label: 'Node 2'}, {id: 3, label: 'Node 3'}, {id: 4, label: 'Node 4'}, {id: 5, label: 'Node 5'} ]; // create an array with edges var edges = [ {from: 1, to: 2}, {from: 1, to: 3}, {from: 2, to: 4}, {from: 2, to: 5} ]; // create a network var container = document.getElementById('mynetwork'); var data = { nodes: nodes, edges: edges }; var network = new vis.Network(container, data, {});