Catherine Pham
Tools to help you create infographics on your own for blogging and marketing
Source: http://visualcontenting.com/2014/12/23/top-9-free-online-tools/
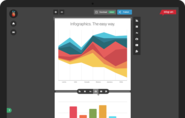
Piktochart is an easy infographic design app that requires very little effort to produce beautiful, high quality graphics. Make your own infographics here.
Canva makes design simple for everyone. Create designs for Web or print: blog graphics, presentations, Facebook covers, flyers, posters, invitations and so much more.
Tell your brand's story with infographics, videos, presentations, micro-content and custom web experiences. Visually is the world's largest marketplace for visual content creation & distribution.
Create infographics and interactive online charts. It's free and super-easy!
Easily Create online Presentations, animations, animated HTML5 banners, infographics and other rich visual content free in your browser. Visme is the perfect alternative to Flash and Powerpoint or keynote to create professional presentations, infographics, HTML5 banners and interactive content in HTML5.
Easel.ly is a simple web tool that empowers anyone to create and share powerful visuals (infographics, posters)... no design experience needed! We provide the canvas, you provide the creativity.
Venngage is an easy to use Infographics Tool and helps you make beautiful Infographic Designs & Themes for free!
InfoActive lets you create and share interactive, visual stories.
Our cloud-based Foresight Visual Analytics Platform empowers rapid visualization of complex business information, large scale research, and dynamic data sets.

Covering all things business, start-up and marketing.