 Saikat Sengupta
Here is a list of SharePoint charting components that allow users to create charts and dashboards in SharePoint.
Collabion allows you to create interactive charts and dashboards from various data sources. Simple plug-and-play interface.
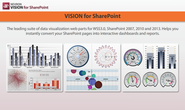
Nevron Vision for SharePoint includes advanced Chart & Gauge Web Parts with Pivot Data Aggregation and exceptional reporting & dashboarding features.
Sharepoint Google Chart Web Part
jqPlot is a plotting and charting plugin for the jQuery Javascript framework. jqPlot produces beautiful line, bar and pie charts with many features:
Build HTML5 data visualizations and interactive charts. Develop sleek business apps with Kendo UI DataViz framework, powered by HTML5, jQuery lightweight library.
SharePoint Chart: Enhance your SharePoint portal with powerful charts and graphs with Chart Plus Web Part. Featuring line, bar, pie, area, and bubble graphs.