Dieter Ratzesberger
Die besten Visualisierungen für Social Media Kanäle auf einen Blick
Visualisierung des Instagram-Profils
Visualisierungstool unter anderem für Facebook und Twitter
Visuelle Darstellungen vieler Informationen aus Facebook
See where you've been and where you might go next. Plot your Foursquare history, discover new places and create an infographic of your data.
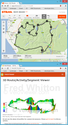
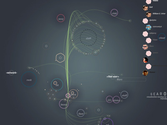
Beeindruckende Darstellung der GPS-Daten aus Strava in einem Aktivitätsrad
3-dimensionale Darstellung von GPS-Touren. View the interactive 3D profile for Guglzipf-Wolfsgeist-Lindkogel
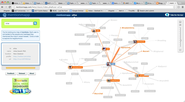
Ein Visualisierungstool für Websites, Fotos, Videos, Text etc. in Form von Perlenbäumen
Create your travel map and show off all your adventures
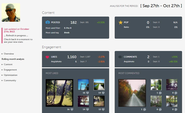
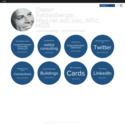
Ein Visualisierungstool für das eigene Social Media Profil
See Dieter Ratzesberger, Mag.rer.soc.oec, MSc, MBA's graphical bio. Built using Vizify, the easiest, most sophisticated tool for showing the best of you online, all in one place. It easily integrates your Facebook, Twitter, LinkedIn, and more.
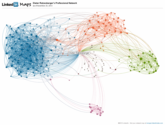
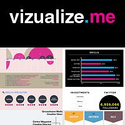
Convert your LinkedIn profile into a beautiful infographic in one click.
Put your career in motion. Create your Resu-ME. Ein Video CV aus den Social Media Profilen
Die Facebook-Chronik von Dieter Ratzesberger als Video
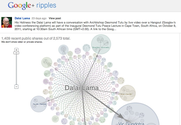
Mit Google+ Ripples können Sie für beliebige auf Google+ geteilte Beiträge oder URLs eine interaktive Grafik erstellen, die zeigt, von welchen Nutzern der Beitrag erneut öffentlich geteilt wurde. So sehen Sie, auf welchen Wegen sich ein Beitrag im sozialen Netz verbreitet hat, und stoßen möglicherweise auf interessante Personen, denen Sie dann ebenfalls folgen können.
Statistiken und Grafiken für G+
Analytics and insights for Schwimmteich's Facebook Page. See statistics, create reports and monitor Facebook marketing success with this free tool.
Tolle grafische Aufbereitung der Performance verschiedener Social Media Kanäle
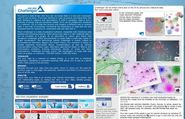
Visualization is a technique to graphically represent sets of data. When data is large or abstract, visualization can help make the data easier to read or understand. There are visualization tools for search, music, networks, online communities, and almost anything else you can think of.
zur Visualisierung des Twitter-Accounts
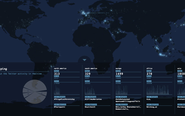
Check out the twitter activity in realtime
Portwiture grabs Flickr photos that match your most recent Twitter updates, creating a serendipitous visual representation of your Twitter profile.
Twitter Begriffe visualisiert
Visualisierungstools von R bis Z
Visualisierungswerkzeuge verdeutlichen Datenzusammenhänge auf optische Weise.