 John Lovett
A list of free resources to help transform data into visual information. I compiled this list while researching my book and imagine that it will grow over time as our data stores reach zettabyte proportions. Please add your ideas and tools to the list.
Source: http://www.amazon.com/Social-Media-Metrics-Secrets-Lovett/dp/0470936274
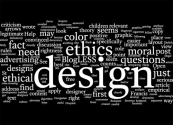
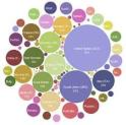
Generate tag clouds by cutting and pasting or by pointing Wordle at a url. Layout and design options allow customization.
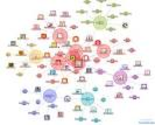
LinkedIn allows you to create a visual representation of your connections. Custom labels allow you to designate relationships between your connections.
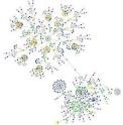
Java applet use Google Search "relate:" to explore connections between websites.
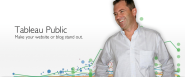
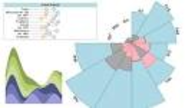
Tableau Public is a free service that lets you create and share data visualizations on the web. Thousands use it to share data on websites and blogs and through social media like Facebook and Twitter. Tableau Public allows you to see data efficiently and powerfully without any programming.
create and share visual ideas online
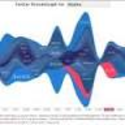
Created by Microsoft's FuseLabs - This tool allows you to create and embed visualizations of Twitter data.
Interactive data visualization software, integrated with data analysis and browsing features.
Facebook App: https://apps.facebook.com/challenger_meurs/
Twitter App: http://www.q1000.ro/twitter
More about Challenger: http://www.q1000.ro/challenger/
iCharts accelerates data storytelling with simplistic, interactive, visualization tools for big and small data providers.
An "experiment" by IBM Research that offers multiple visualization options and datasets to play with.
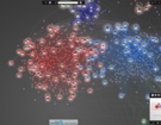
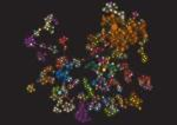
A desktop application that lets you visualize Flickr and LastFM networks using tags as "magnets" that demonstrate connections.
Type in any url and watch as the java applet builds out links, tables, tags, images and forms in technicolor splendor.
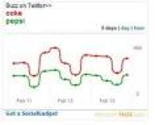
Visualize Twitter activity by hashtag or user id to identify trending topics and popular subjects.
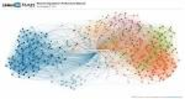
An interactive visualization and exploration platform for all kinds of networks and complex systems, dynamic and hierarchical graphs.
A graphical approach to visualization project from Standford. It composes custom views of data with simple marks such as bars and dots.