 Courtney Livingston
Tools to help with statistical modeling, data visualization (charts, graphs, infographics) and sources for research (web data and survey tools). Some allow you to upload your own data, while others give you sets of data to choose from.
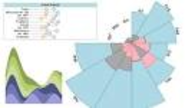
Data visualization for PC and Mac. Filter, analyse and edit information in interactive point-and-click graphs, charts and maps, import web content, and create slider-driven models.
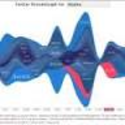
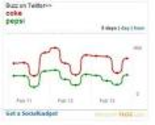
Visualize Twitter activity by hashtag or user id to identify trending topics and popular subjects.
Award-winning business intelligence software for faster data analysis and better business dashboards. See your data clearly using our data visualization capabilities. No deployment. No waiting. Just instant results.
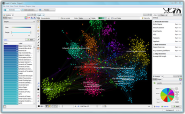
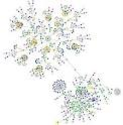
Gephi is an open-source software for visualizing and analyzing large networks graphs. Gephi uses a 3D render engine to display graphs in real-time and speed up the exploration. Use Gephi to explore, analyse, spatialise, filter, cluterize, manipulate and export all types of graphs.
Powerful, simple to use, and free.
Solution for creating delightful charts, gauges & maps in JavaScript & Flash.
The QlikView Business Discovery platform delivers true self-service business intelligence that empowers business users and drives innovative decision making
Drive your search marketing, business development, media planning and competitive strategy with the most powerful data on the planet.
Alexa provides information about websites including Top Sites, Internet Traffic Stats and Metrics, Related Links, Online Reviews Contact Information and Search Analytics for SEM and SEO optimization. The Alexa Toolbar is a browser add-on that shows data about sites as you surf the web.
Quantcast enables you to buy and sell targeted audiences in real time, and allows advertisers to view free audience reports on millions of web properties.
Create surveys, manage your respondents, collect, compare, and track responses. Brand your surveys and review them with a powerful analytics system. Find out what your staff, users and customers think.
Creates surveys or interviews to test your assumptions and provides feedback on market signal.
Zwoor Survey is a friendly, robust and cost effective survey platform that enables you to gather real insight into your event participants. Be that in a large,10,000 people keynote event with no connectivity, or in a small presentation, we can handle both.
Get started with customer development for free by creating your own initial customer development survey.
A persona is a narrative that describes the person your product will be used by. It can be a valuable tool, one where the act of creating it has as much value as the artifact you will creating.
Generate tag clouds by cutting and pasting or by pointing Wordle at a url. Layout and design options allow customization.
Created by Microsoft's FuseLabs - This tool allows you to create and embed visualizations of Twitter data.
Interactive data visualization software, integrated with data analysis and browsing features.
Facebook App: https://apps.facebook.com/challenger_meurs/
Twitter App: http://www.q1000.ro/twitter
More about Challenger: http://www.q1000.ro/challenger/
iCharts accelerates data storytelling with simplistic, interactive, visualization tools for big and small data providers.
Type in any url and watch as the java applet builds out links, tables, tags, images and forms in technicolor splendor.
A graphical approach to visualization project from Standford. It composes custom views of data with simple marks such as bars and dots.
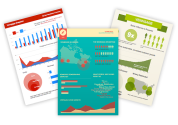
Like infographics and data visualizations? Visual.ly is the world's largest community of dataviz and infographics. Come explore, share and create.
create and publish custom inforgraphics
Graph visualization and social network analysis software uses Google Search "relate:" to explore connections between websites.