 Lisa Johnson
Sharing educationally focused infographics and tools and site for supporting and creating them.
A promo piece (2:26) for my ISTE11 Presentation "A Picture is Worth 1000 Words: Infographics as a Creative Assessment". Royalty free music from Soundzabound.com entitled "Bobby Sox Hop".
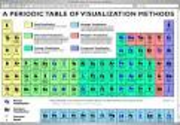
A Periodic Table of Visualization Methods
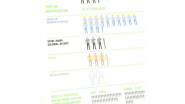
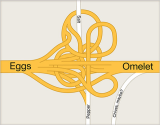
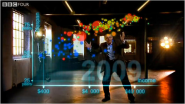
An animated infographic
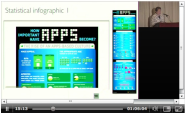
TED Talks David McCandless turns complex data sets (like worldwide military spending, media buzz, Facebook status updates) into beautiful, simple diagrams that tease out unseen patterns and connections. Good design, he suggests, is the best way to navigate information glut -- and it may just change the way we see the world.
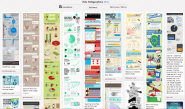
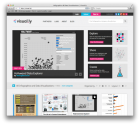
Over 300 Infographics focusing on education.
Interactive Infographics are online representations of information or data that usually allow the user to “interact” with it and the data that is visualized. They’re generally created by newspapers for their websites, and often, though not always, are accessible to English Language Learners. In fact, they can be an exceptionally accessible way for ELL’s to learn complicated information that might ordinarily not be comprehensible.
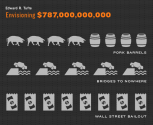
_ Books about Infographics Eric K. Meyer Designing Infographics Hayden Books, 1977 Edward R. Tufte The Visual Display of Quantitative Information Graphics Press (2d ed.), 2001 Jenn & Ken Visocky...
This week is Infographics Week on The Learning Network because we know how important it is for students to be able to read and interpret visual representations of information - and because The New York Times consistently creates useful and elegant examples that we think teachers across the curriculum should know about.
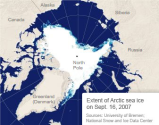
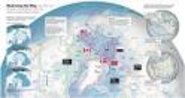
Charts, interactive maps and other visualizations that can help students understand key issues and topics in current events and politics, history and economics.
Charts, graphs, interactive maps and other visualizations that can help students understand key issues and topics in health and science.
Fantastic Infographics for Medical, Mapping, and Science
Charts, graphs, interactive maps and other visualizations that can help students understand key issues and topics in ELA/ELL, arts and entertainment, travel and sports.
So TechChef4U has caught the Infographics Influenza! Being a bit of a Pinterest fanatic, I have found an easy way to support and feed my Infographics Habit. Continuing to stock pile Educational Infographics on my Pinterest board, I waited until I found an app-ortunity to share these resources with one of my teachers and create a delectable lesson. During my stint as an 8th Math tutor, I had a few of the teachers approach me about engaging math lessons that they could utilize with 8th Math after the STAAR test. I mentioned the topic of infographics and shared a few of the ones I had collected. Then I worked with one of the teachers in particular, Mrs. Simpson, to hash out the details.
Now that Obama's dog has won the War on Christmas, or something, it's time to get down to a war…
For use with any day of the NY Time's: "Warm-up activities, curriculum extensions, skill builders, literacy games, substitute lessons, or just for fun: this collection of reusable activity sheets in PDF is one-stop shopping for all of these purposes and more."
New resources for our growing collection on teaching with infographics.
Here is a cool website for the work of Edward Tuftie. Tuftie has been representing data graphically for decades. His work encompasses many disciplines, and he does everything from showing in galleries to traveling the country giving one-day courses. The New York Times called him the Leonardo da Vinci of data.
The argument for using infographics is simple. They’re cool. Data and statistics never looked so good. That’s what they said, anyway, and by
April 11th, 2012 |
Published in
Assessment, Teaching Math, Visual Thinking, Wisdom of Crowds | Tagged with Analytic Rubrics, Infographics, Social Bookmarking | 2 Comments
Working in the Visualization Our world experience is increasingly being archived, indexed, and measured, and this massive quantity of...
Editor’s note: This post is part of an ongoing series published every Monday that examines the top 100 tech tools in a given category. Follow @DailyTekk on Twitter to make sure you don’t miss a week!
Information is very powerful but for the most bit it is bland and unimaginative. Infographics channel information in a visually pleasing, instantly
Assuming you’re not working for a media corporation with huge graphics and statistics departments at your disposal, you may want to create some infographics for your own articles. With today&...
Information graphics or infographics are visual representations of information, data or knowledge. These graphics are used where complex information needs to be explained quickly and clearly, such as in signs, maps, journalism, technical writing, and educ

CEO & Founder of TechChef4u, ADE 2013, Eanes ISD 1:1 iPad K-12
For Chic Geek iJewelry: http://goo.gl/5hKQNU
For all things TechChef4u, visit www.techchef4u.com